Home » Posts tagged 'Aleph' (Page 2)
Tag Archives: Aleph
Batch Loading of Serials Invoices into Aleph
‘Tis the season for libraries to receive larger invoices (from EBSCO and others). This is just a quick reminder that Aleph can batch load inbound electronic invoices.
The campus should always check these invoices to see if they appear to be correct. Several areas where problems can arise:
- insufficient budget allocations
- an encumbrance not already added for the current fiscal year
- vendor has made a mistake with the invoice itself
- invoice batch file is only available to download for 30 days
Please submit a ticket to the CUNY Service Desk ([email protected]) stating that the invoice file is ready to be loaded, along with the notification from EBSCO. (The notice has key information, such as the file name and invoice number.)
For more details, please see the OLS Support Site.
Analytics: Meet the OLS Dashboard
Here it is: version 2.0 of our new OLS Dashboard:
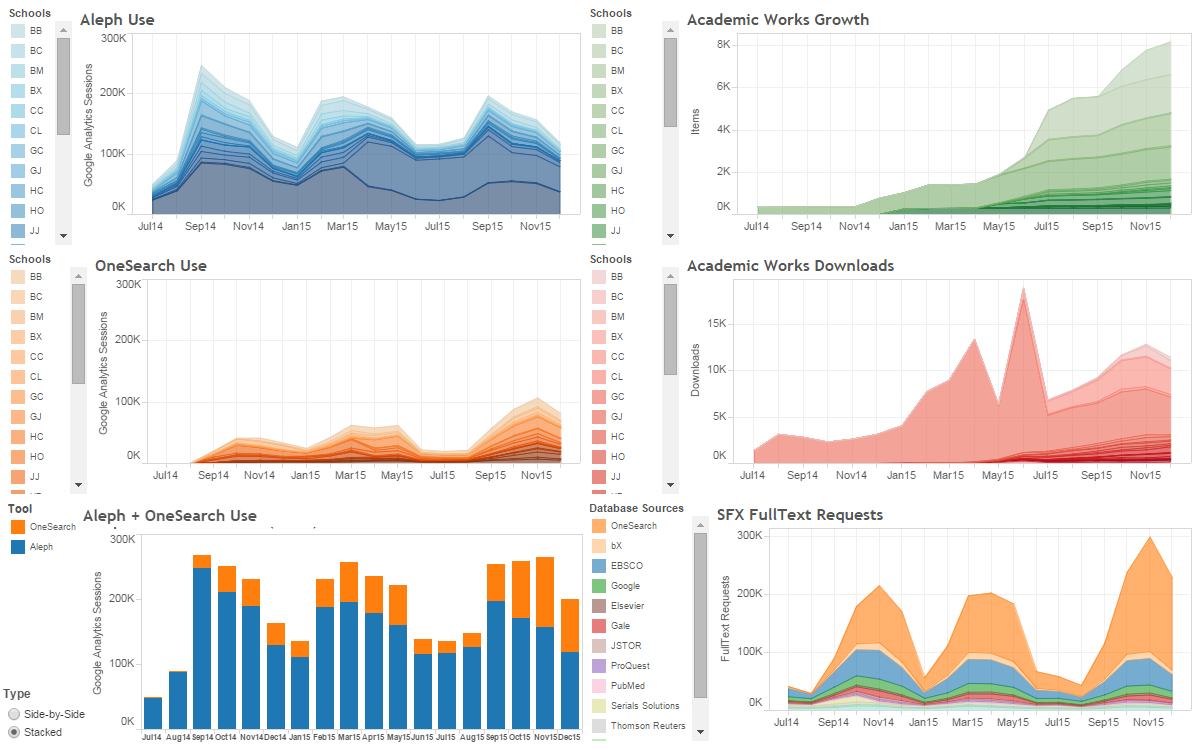
You can enter the OLS Dashboard from the link above or go directly to a full view of any of the included graphs via the links below:
Information about the source data for each of the graphs is displayed at the bottom of the individual graph page, not on the overview/dashboard page.
Try these features:
- Click on a legend point in any of the graphs. This will offer a popup window with 2 options: “Keep Only” and “Exclude.” Selecting one of these options will filter the information only in this single graph, changing it to display only the selected data. Note, however, that the static 0-300K vertical axis makes it difficult to see individual school data.
- There is an “Undo” option at the bottom-left of the page to remove a single filter action. Use the “Reset” option to remove multiple filtering steps at once.
- Double-click on any graph to zoom in on the data. Once that is done, a “Home” button appears to take you back to the original view. The “Undo” and “Reset” buttons also work on these changes.
OLS is currently using Tableau Public’s free service to bring you this information. (Check the Tableau Public Status page if you can’t get to our OLS Dashboard.)
[Note that this blog post was updated on 27 April 2016 to point to v2.0 of the OLS Dashboard. The image at the top is still the original v1.0 OLS Dashboard.]
Analytics: Getting to Know Our Users
Who is using OLS systems like the CUNY Catalog (Aleph), OneSearch, Academic Works, and this blog? What devices are being used to access our sites?
OLS wants to provide these and many other valuable answers. Most of the OLS library systems have some built-in reporting ability. Unfortunately, these systems are separate silos of information, not easily related to each other. In April 2015, OLS standardized use of Google Analytics (GA) on all platforms. We will be reporting on the information provided by GA and from the other, product-specific sources in future blog posts. The data provided below reflects GA data from April though December 2015.
So, now that we have all that data: Who are our visitors?
Language = English
99% CUNY Catalog (Aleph)
98% OneSearch
87% Academic Works
At Academic Works, these international uses are well distributed. The languages that reach 1% are: Chinese 2%; Spanish 2%; French 1%; German 1%, and Russian 1%.
33% Blog
Blog reader languages are, in fact, unclear because it has a high percentage of “unknown” language readers: 57%. The only other language over 1% is Russian at 9%.
Location = USA
99% CUNY Catalog (Aleph)
99% OneSearch
47% Blog
Blog reader locations are better reported than languages because the percentage of “unknown” locations is only 15%. The locations that reach 2% are Russia (12%), China (3%), and Japan and Germany at 2%.
***Academic Works — Deriving correct location information for Academic Works is a work in progress.
All Platforms
From where do our users do their searching?
         Aleph   OneSearch AcadWorks  OLS Blog
Desktop   96%       88%       85%       87%
Tablet     2%        4%        4%        1%
Phones     2%        8%       11%       12%
Browser (top 4)
Chrome    23%       45%       47%       68%
Firefox   57%       19%       22%       12%
I E       10%       15%       11%        5%
Safari    10%       20%       16%       13%
OS, All (top 5)
Android    0%        3%        5%        1%
IOS        2%        7%        9%       12%
Linux     42%        1%        1%        1%
Mac       16%       28%       22%       57%
Windows   39%       61%       62%       26%
Mobile (tablet + phone)
Mobile Devices (top 5)
iPad      45%       29%       19%        4%
iPhone    13%       25%       41%       89%
Galaxy S5  2%        3%        2%        0%
Unknown   23%       18%        9%        2%
Win Tablet 6%        5%        1%        0%
Mobile OS (top 3)
Android   13%       24%       33%        5%
IOS       58%       54%       60%       93%
Windows   29%       22%        4%        1%
We’re in the process of building an analytics dashboard, so our next analytics post will include a link to the OLS Analytics dashboard.
If you’re interested in CUNY library analytics, be sure read Roland’s blog post: Impact of Primo on SFX