Home » Articles posted by Joan Kolarik
Author Archives: Joan Kolarik
Analytics: Circulation Activity Comparison Tool
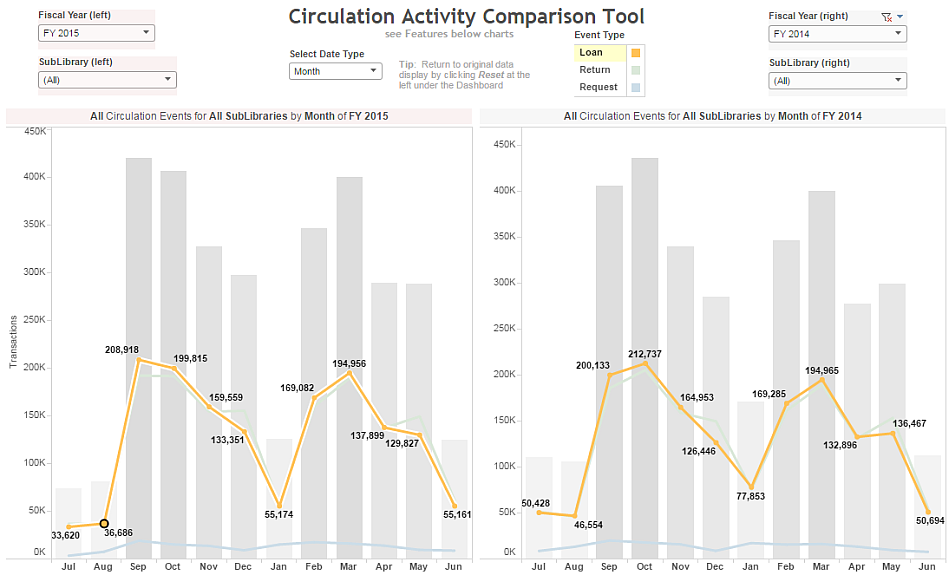
In January, we introduced you to a CUNY OLS dashboard showing usage of our main library systems. That dashboard continues to be updated each month and we recently improved it, giving it in a new look and providing more school-specific detail.
Now we have a fun new offering: the Circulation Activity Comparison Tool!

Features
- Select Date Type to change the view from monthly to display by weekdays or by hours
- Click on a single Event Type to view only one type of circulation event: Loans, Returns, or Requests
- The title of each chart will change automatically to display the current selections for that chart
- Remove all filter selections by clicking Reset at the left under the charts
- Remove your last filter selection by clicking Undo in the same location
- Includes data from Fiscal Years 2014, 2015, and 2016 (through March 2016)
- Filter by a single SubLibrary or an entire Library (select all relevant SubLibraries in the drop-down selection box)
- Click on the Loans line (or Returns or Requests) to display that line’s transaction counts (as we did in the above image)
- Fiscal Year and SubLibrary selections are applied to one chart only
- Select Date Type and other selections are applied to both charts
Using this tool, you can easily
- Check your library’s peak hours for loans, returns, and requests
- View your library’s traffic by day of the week
- Compare 2 Fiscal Years by selecting different years on the left and right
- Compare 2 Libraries (select all SubLibraries for one on the left and for another on the right)
- Compare 2 SubLibraries
- Mix and match
Acknowledgments
OLS is currently using Tableau Public’s free service to bring you this information. Check the Tableau Public Status page if you can’t access our OLS dashboards.
We owe a huge thank you to Jennifer Murray at SUNY Buffalo for sharing not only their Tableau dashboard but also the logic used to create it. This allowed us to build on the work they did and adapt it to our needs at CUNY. In that same spirit, the logic we used appears below.
Technical Details
The data source is the Aleph Z35 Events table.
The selected fields are: Time Stamp (includes date, hour), Date (formatted), SubLibrary, and Circulation Event Type (groups 1 or more related events together)
Circulation Event Type Criteria
- Loan: selected loan transactions
- Return: return transactions
- Requests: hold request transactions
Other Details
- Limit to certain transaction types
- Limit transaction dates to the 2 previous fiscal years plus the current fiscal year (July 2013-current date)
- The order-by option is not required and merely makes the output easily scannable
- The output is tab-delimited
SQL
set heading off
set pause off
set pagesize 0
set linesize 2900
set colsep |
select z35_time_stamp || chr(9) || substr( z35_event_date, 5, 2) || '/' ||
substr( z35_event_date, 7, 2) || '/' || substr( z35_event_date, 1, 4)
 || chr(9) || Z35_SUB_LIBRARY || chr(9) ||  ( CASE
WHEN z35_event_type IN ('50','56') THEN 'LOAN'
WHEN z35_event_type in ('61') THEN 'RETURN'
WHEN z35_event_type in ('71','72','73','74') THEN 'REQUEST'
END)
from xxx50.z35  -- where 'xxx' is your library prefix
where z35_event_type in ('50','56','61','71','72','73','74')
and z35_event_date > '20130630'
and z35_event_date < '20160401'
order by z35_time_stamp
;
exit
How is the “Journal” filter in OneSearch populated?
When you click on the “Journal” facet after doing a search, it almost always displays about 20 journal titles. However, in a search with thousands of results, you are obviously retrieving many more journals than that. And it doesn’t look like it’s the top 20 journals, either, because some of the hits for the same title are quite low. So what’s going on?
Most facets are created dynamically from search results. The 200 top-ranked records in a search result are used to create the list of facet values which will display in the “Expand My Results” section. All hits in the search results for those values are counted and the number is displayed in parentheses to the right of the facet value. So, really, it is not the 20 most common journals in the result, it is (at least in theory) the 20 most relevant journals.
Furthermore, the “Journal” facet includes newspaper titles, too, since it’s really a category consisting of serials. The resource type “Newspaper Articles,” on the other hand, refers to just articles within newspapers and “Articles” refers to articles in journals and other periodicals. Material types depend on the way the content is cataloged, whether it is by local catalogers (in the CUNY Catalog and CUNY Academic Works) or by the vendor (in the Primo Central Index).
Analytics: Meet the OLS Dashboard
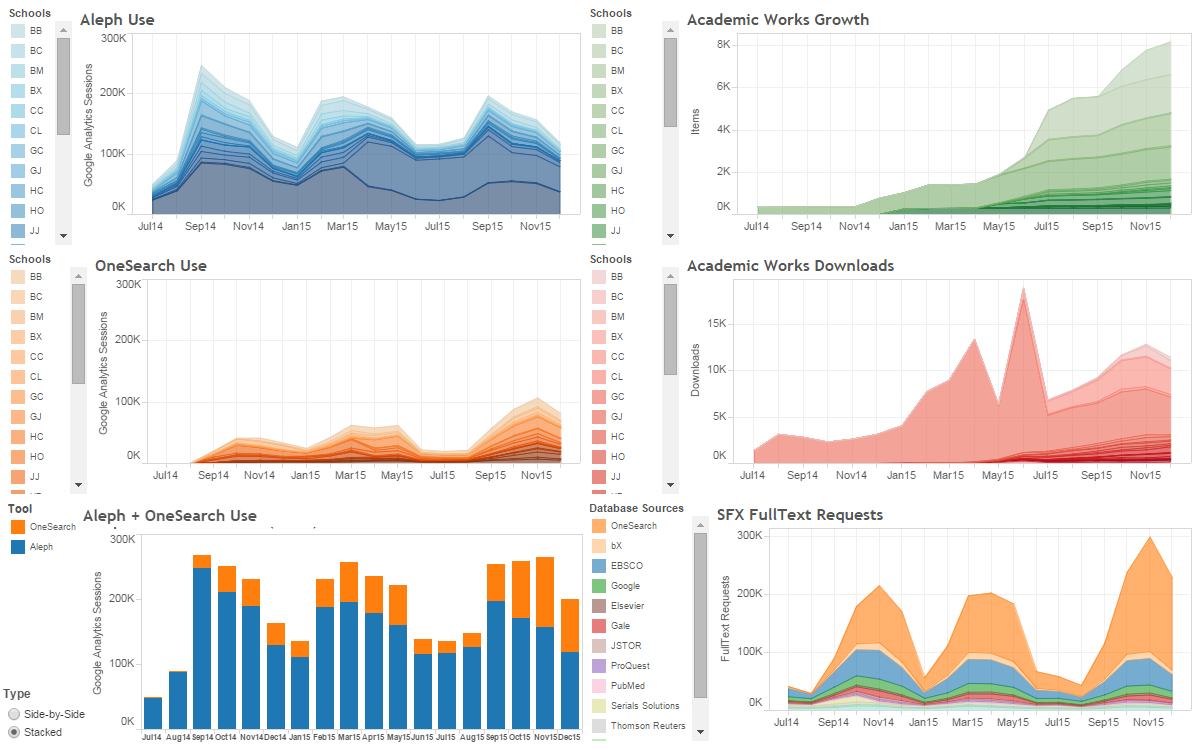
Here it is: version 2.0 of our new OLS Dashboard:
You can enter the OLS Dashboard from the link above or go directly to a full view of any of the included graphs via the links below:
Information about the source data for each of the graphs is displayed at the bottom of the individual graph page, not on the overview/dashboard page.
Try these features:
- Click on a legend point in any of the graphs. This will offer a popup window with 2 options: “Keep Only” and “Exclude.” Selecting one of these options will filter the information only in this single graph, changing it to display only the selected data. Note, however, that the static 0-300K vertical axis makes it difficult to see individual school data.
- There is an “Undo” option at the bottom-left of the page to remove a single filter action. Use the “Reset” option to remove multiple filtering steps at once.
- Double-click on any graph to zoom in on the data. Once that is done, a “Home” button appears to take you back to the original view. The “Undo” and “Reset” buttons also work on these changes.
OLS is currently using Tableau Public’s free service to bring you this information. (Check the Tableau Public Status page if you can’t get to our OLS Dashboard.)
[Note that this blog post was updated on 27 April 2016 to point to v2.0 of the OLS Dashboard. The image at the top is still the original v1.0 OLS Dashboard.]


